AMS 2026: OBSvCAM

Object-Based Storm-tracking for Verifying Convection-Allowing Models

Animations + Visualizations
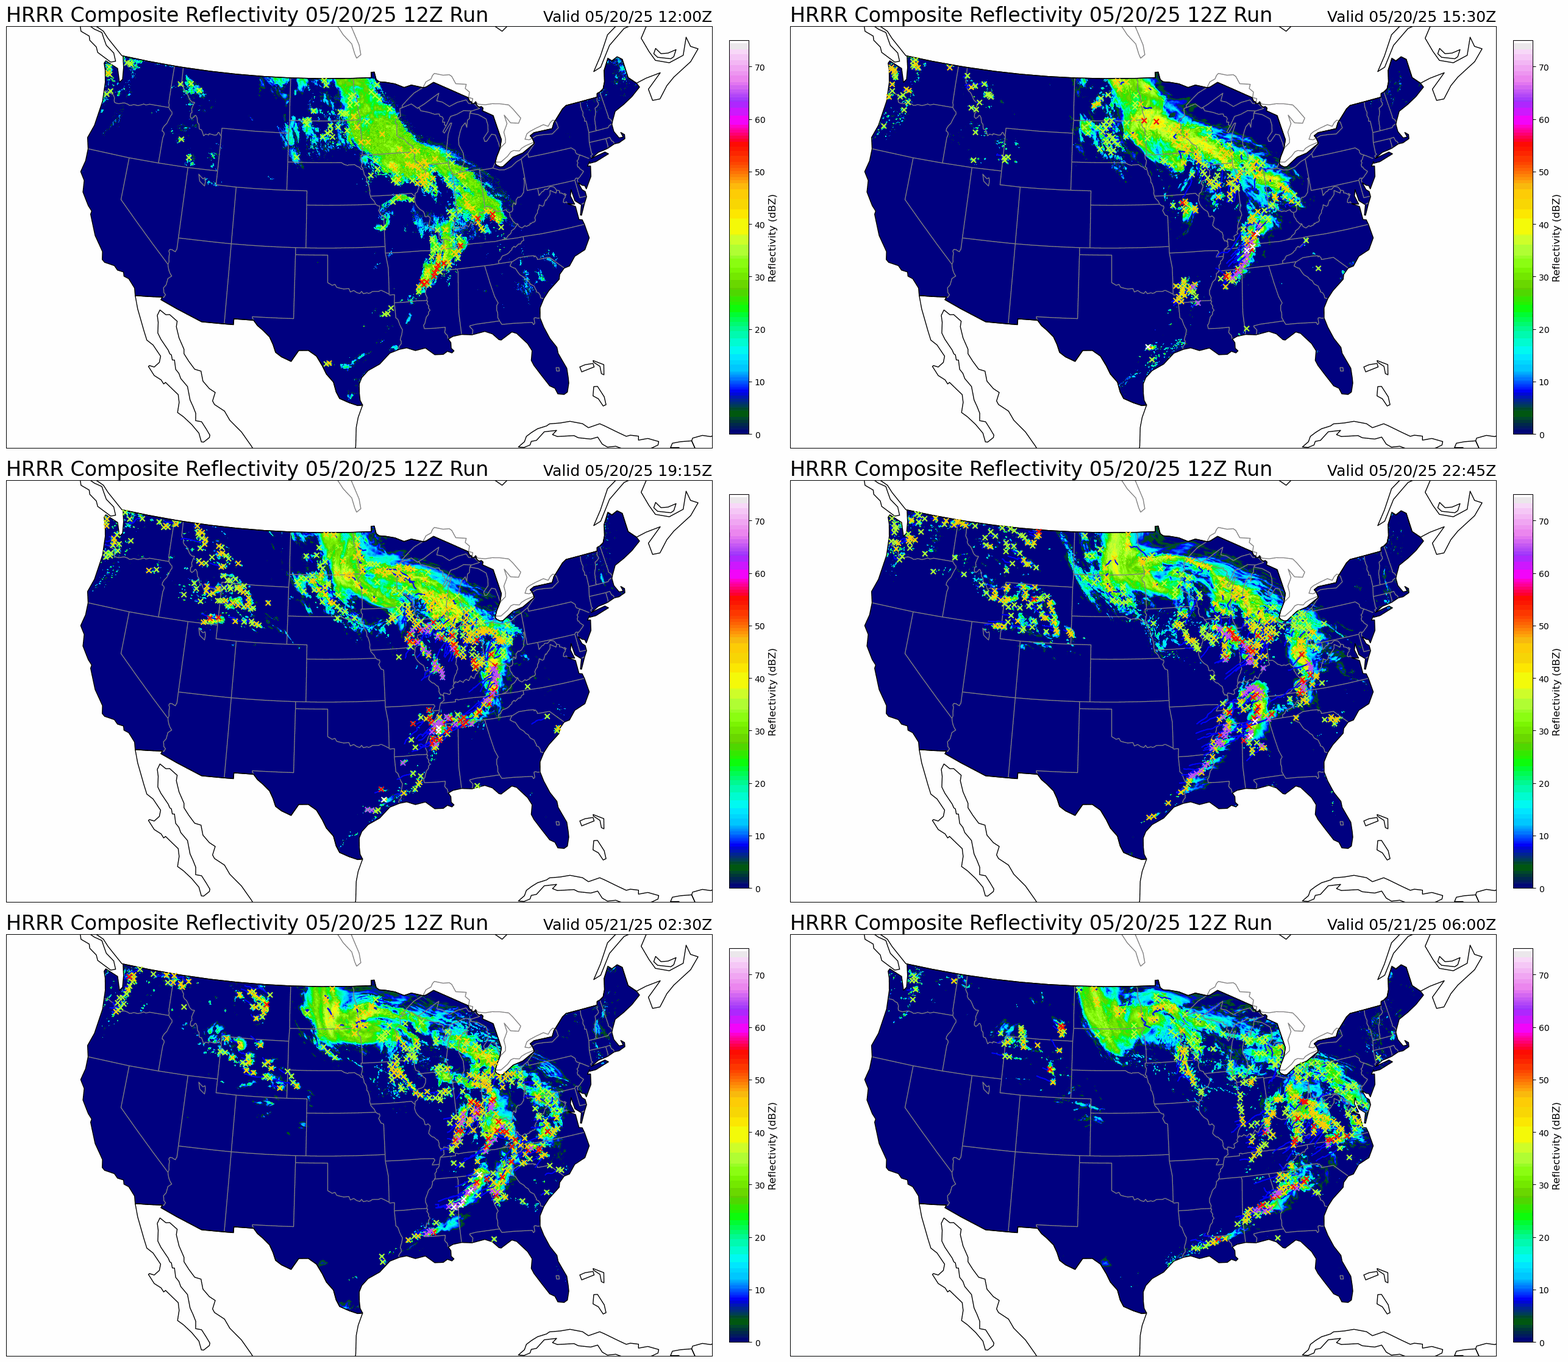
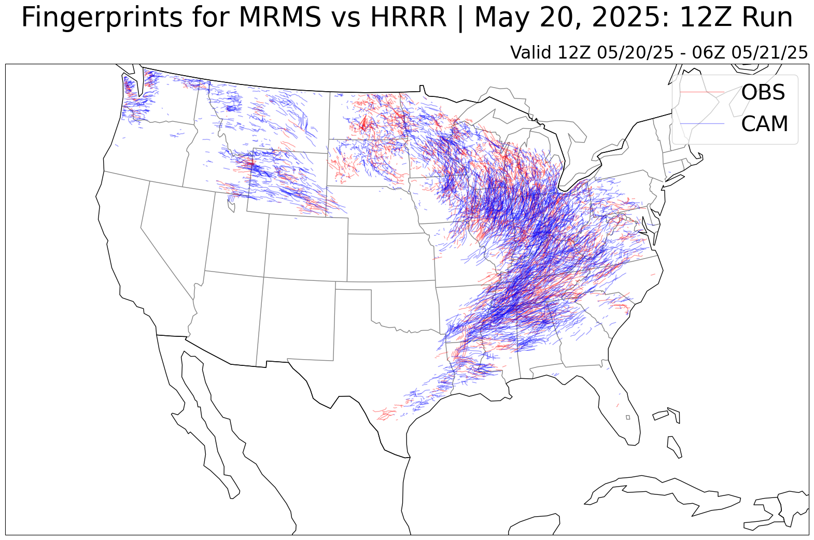
The track for each storm from above is plotted to produce a “Fingerprint” for the 12Z sub-hourly run of the model. The HRRR (CAM)’s output is plotted in blue over the MRMS (OBS) tracks valid for the same time period. This single image helps give an intuitive understanding of the model’s performance for this 18-hour run.
The video above shows “Fingerprints” for the tracks of every sub-hourly HRRR run (0Z-23Z) — and the corresponding MRMS tracks — for May 2025.
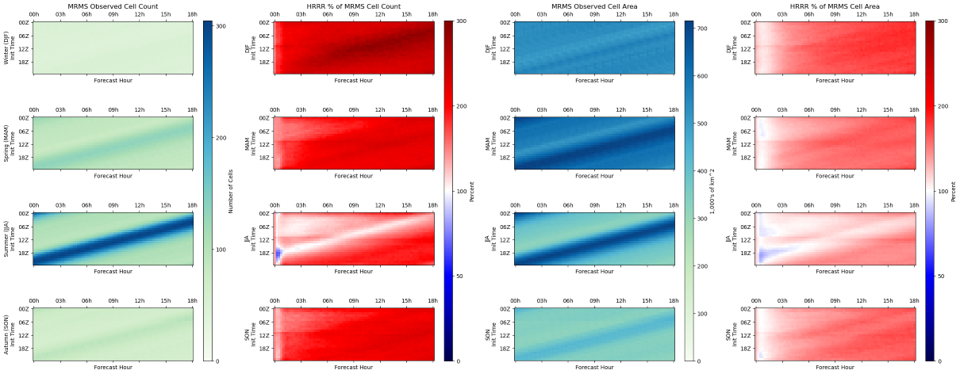
Here is a statistical overview of the median number of cells for the entire Dec 2020 – Sept 2025 dataset (45,000 + runs of the HRRR and the associated MRMS tracks for the contiguous United States: dataset methods described in the poster).
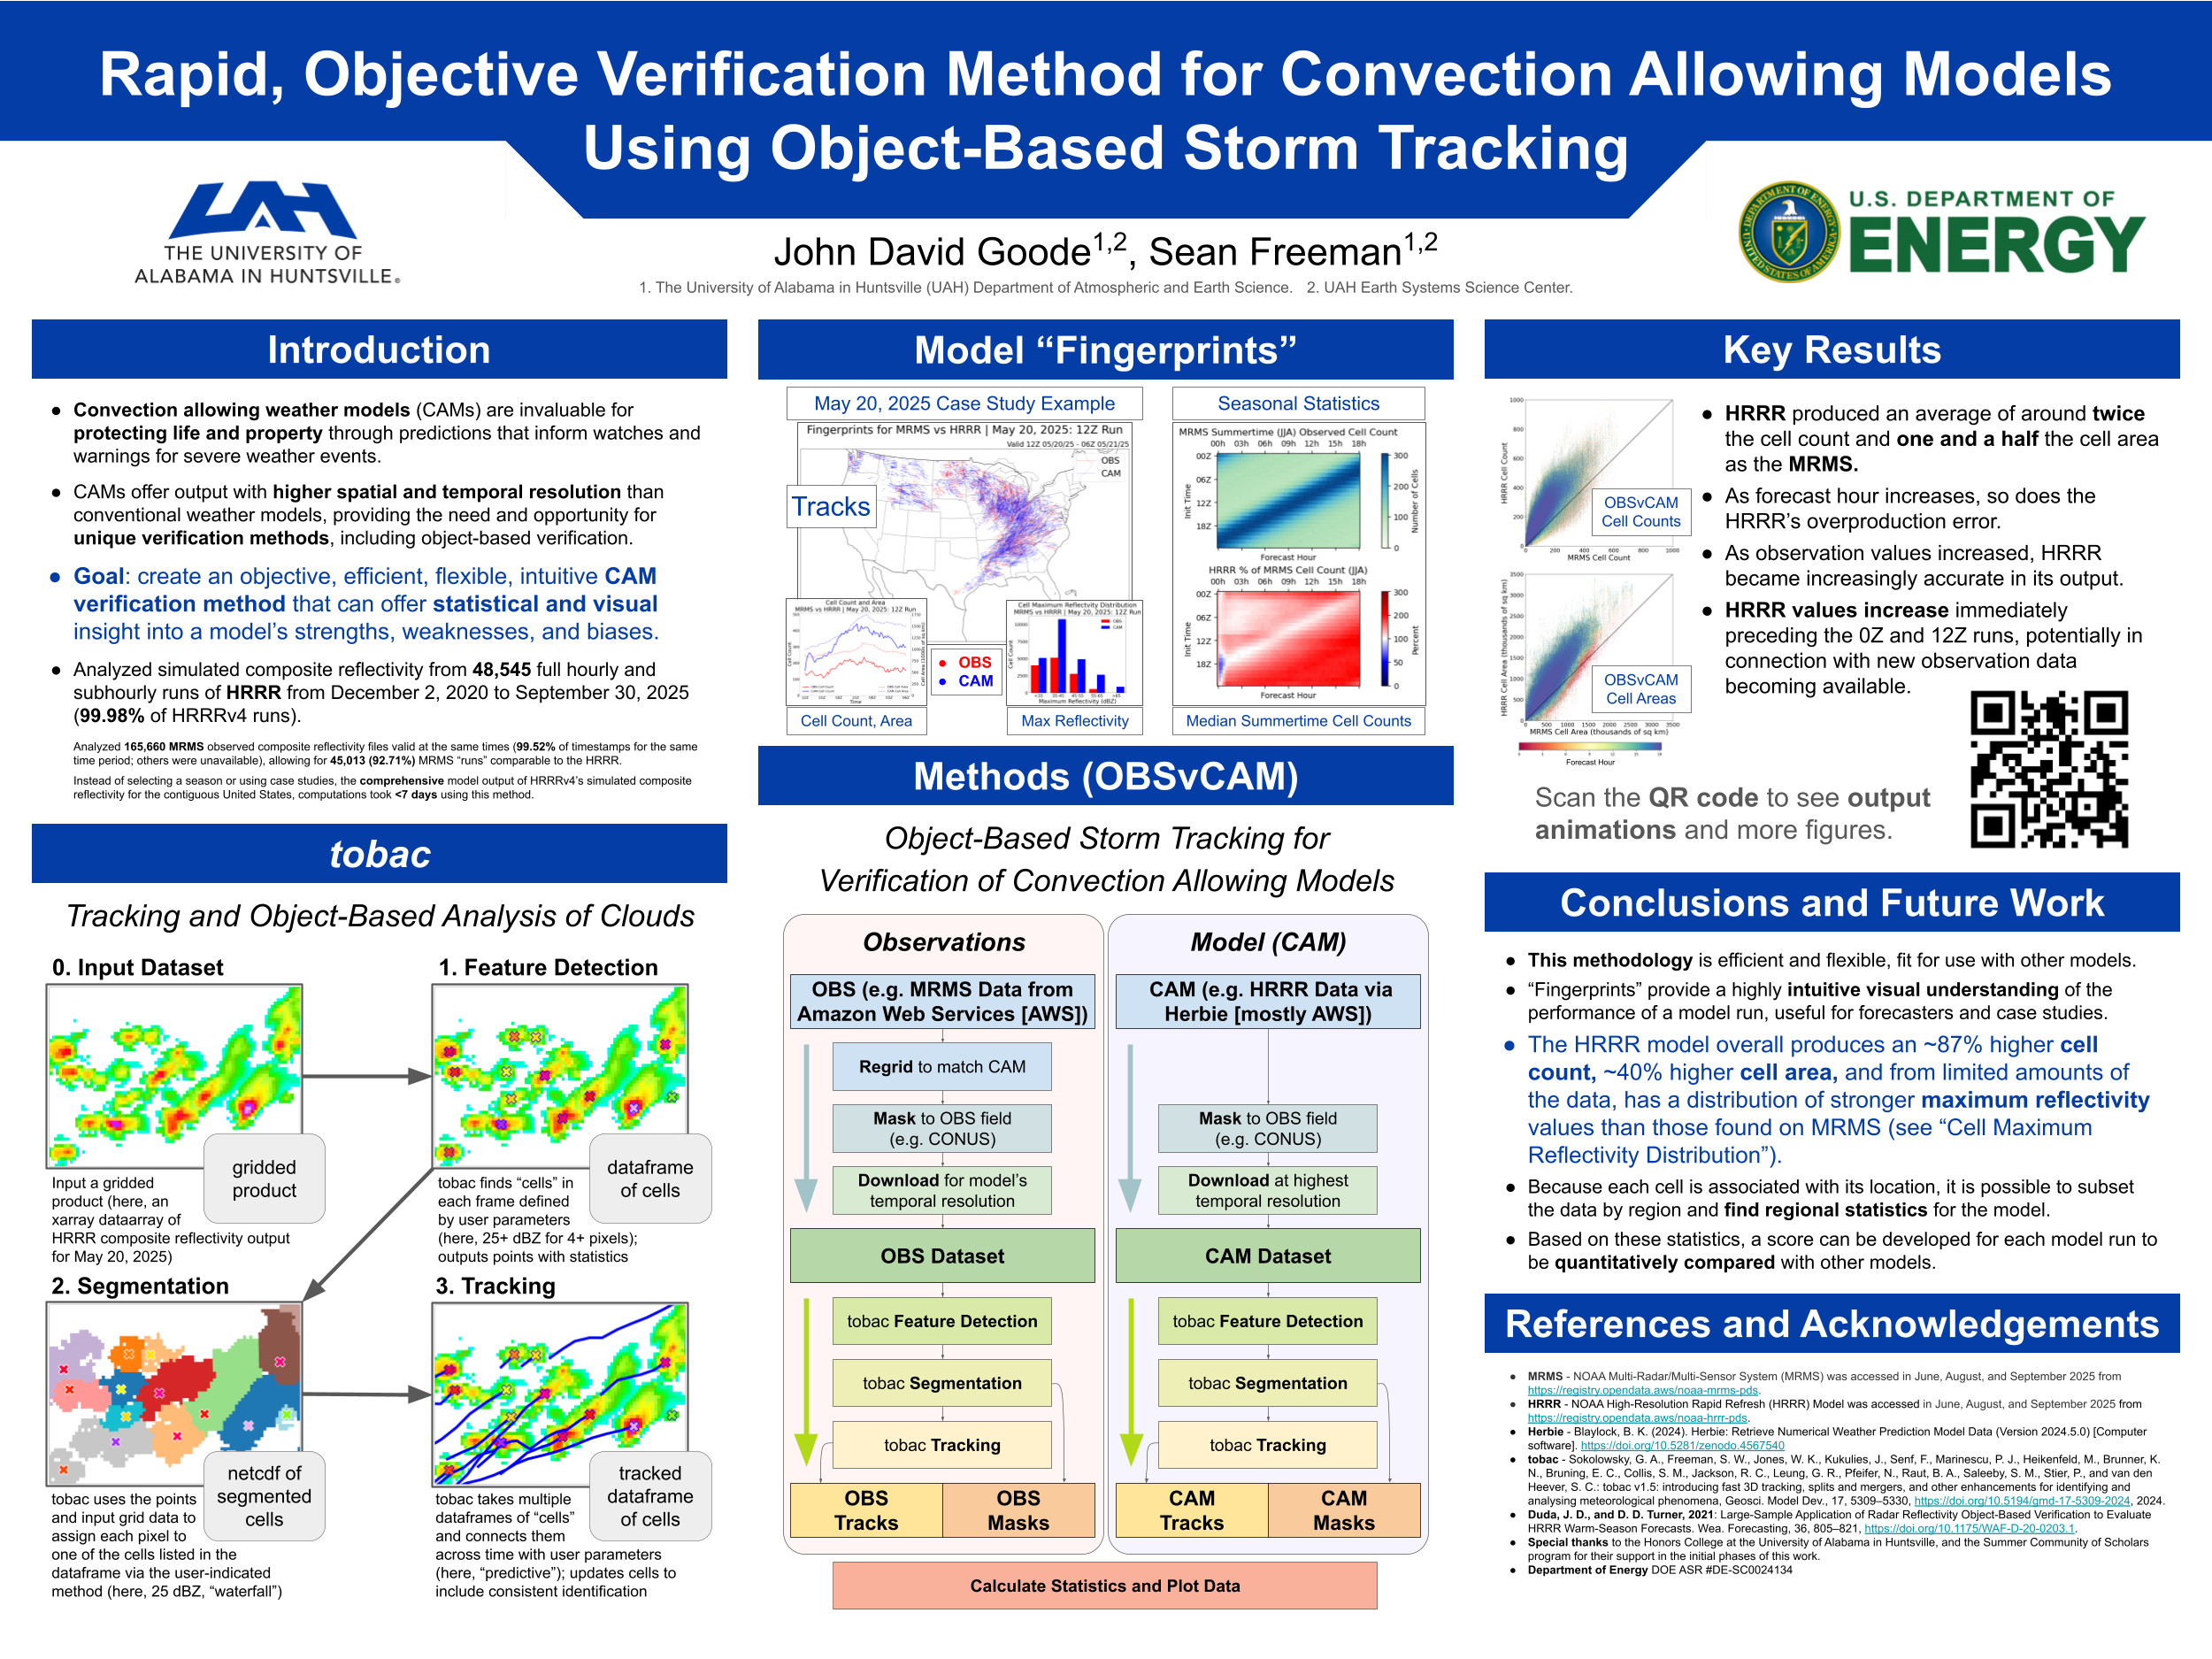
Poster presented at the 2026 AMS Student Conference in Houston, Texas. (Click the image to open in a new tab.)

This research was completed in the CASPR Lab at the University of Alabama in Huntsville and through the Earth Systems Science Center. I would like to thank Dr. Sean Freeman for making this research possible, and for his encouragement and mentorship that have impacted me beyond the scope of this project.